

National Identity
- Official name
- Republic of Uganda
- Official name (in Swahili)
- Jamhuri ya Uganda
- Name etymology
the name is derived from the Swahili word u, meaning "land" or "country," and the Ganda people; the origin of the Ganda name is unclear
Sources:- Constitution of the Republic of Uganda ↗ - Parliament of the Republic of Uganda
- The World Factbook: Uganda - CIA
- Coat of arms
- National flag
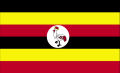
As published by the Office of the Vice President of Uganda The Uganda Flag consists of six equal horizontal bands of black (top), yellow, red, black, yellow, and red (bottom); a white disc is superimposed at the centre and depicts the national symbol, a grey crowned crane, facing the hoist side.
As published in EnglishAs published by Uganda’s NAM Chairmanship 2024-2027 Black symbolizes our African heritage and the fertile soils of Uganda; Yellow represents the glorious sunny days, so characteristic of Uganda; and Red is symbolic of the blood that runs through our veins and that links us to the rest of humankind.In the middle of the flag stands the majestic crested crane (Regulorum gibbericeps), Uganda’s national emblem (which symbolizes Uganda's forward movement)
As published in EnglishAs published by the Office of the Vice President of Uganda The flag was designed by the Ugandan Minister of Justice, Grace Ibingira.
As published in EnglishAs published by the Uganda High Commission in Canberra The flag of Uganda (Ugandan Languages: Bendera ya Uganda) was adopted on 9 October 1962, the date that Uganda became independent from the British Empire.
As published in EnglishSources:- vicepresident.go.ug ↗ - the Office of the Vice President of Uganda
- nam.go.ug ↗ - Uganda’s NAM Chairmanship 2024-2027
- canberra.mofa.go.ug ↗ - the Uganda High Commission in Canberra
- National anthem
- Oh Uganda, Land of Beauty!0:44
- Title
- Oh Uganda, Land of Beauty!
- Lyrics
- English
1Oh Uganda! may God uphold thee, We lay our future in thy hand. United, free, For liberty Together we’ll always stand.
2Oh Uganda! the land of freedom. Our love and labour we give, And with neighbours all At our country’s call In peace and friendship we’ll live.
3Oh Uganda! the land that feeds us By sun and fertile soil grown. For our own dear land, We’ll always stand, The Pearl of Africa’s Crown.
Source: - Citizens
- Ugandans
- Official name:Constitution of the Republic of Uganda ↗ - Parliament of the Republic of Uganda
- Official name, Citizens:The World Factbook: Uganda - CIA
- Coat of arms:Image credit
- National flag:vicepresident.go.ug ↗ - the Office of the Vice President of Uganda
- National flag:nam.go.ug ↗ - Uganda’s NAM Chairmanship 2024-2027
- National flag:canberra.mofa.go.ug ↗ - the Uganda High Commission in Canberra
- National anthem:nationalanthems.info ↗
Geography
- Location
- East-Central Africa, west of Kenya, east of the Democratic Republic of the Congo
- Total area
- 241,038 km²
- Land area
- 197,100 km²
- Water area
- 43,938 km²
- Land borders
- 2,729 km(5 countries)
- Kenya
- 814 km
- South Sudan
- 475 km
- Tanzania
- 391 km
- Rwanda
- 172 km
Source:- The World Factbook: Uganda - CIA
- Coastline
- 0 km(Landlocked)
- Terrain
Mostly plateau with rim of mountains - Highest point
- 5,110 mMargherita Peak on Mount Stanley
- Lowest point
- 614 mAlbert Nile
- Climate
Tropical generally rainy with two dry seasons (December to February, June to August); semiarid in northeast - Avg. temperature
- 23.1 °C
- Avg. daily range
- 19 to 28 °C
- Annual precipitation
- 1,577 mm
Temperature °CMeanDaily rangePrecipitation mmMonthly climate normals Month Avg. high, °C Mean, °C Avg. low, °C Precipitation, mm January 29.4 24.1 19.3 65 February 30.4 24.8 19.9 61 March 29.6 24.4 20 130 April 27.9 23.3 19.6 197 May 27.2 22.8 19.2 174 June 27 22.5 18.7 117 July 26.7 22.1 18.3 111 August 26.9 22.2 18.4 142 September 27.5 22.6 18.6 137 October 27.4 22.7 18.9 182 November 27.3 22.7 18.8 163 December 28.2 23.3 18.8 97 Country-wide averages over 1991–2020.
Sources:- The World Factbook: Uganda - CIA
- Climate Change Knowledge Portal (ERA5 reanalysis) ↗ - World Bank
- Weather
- Loading
- Land use2023
- Arable34.4%Perm. crops11.0%Pasture26.5%Forest12.1%Other16.0%
- Arable land
- 6,900,000 hectares (34.4%)
- Permanent crops
- 2,200,000 hectares (11.0%)
- Permanent meadows & pastures
- 5,315,000 hectares (26.5%)
- Forest
- 2,423,866 hectares (12.1%)
- Other land
- 3,213,134 hectares (16.0%)
Source: - Major lakes
- Lake Victoria62,940 km²Lake Albert5,590 km²Lake Kyoga4,430 km²Lake Edward2,150 km²
- Natural hazards2026
- Epidemics7.7Very high#5/191Drought6.5High#18/191River floods3.9Medium#117/191Earthquakes3.7Medium#92/191Tsunamis0.0Very lowTropical cyclones0.0Very lowCoastal floods0.0Very low
Scores out of 10, ranks out of 191 countries.
Source:- INFORM Risk Index ↗ - European Commission Joint Research Centre
- Location, Land borders, Coastline, Terrain, Highest point, Lowest point, Climate, Major rivers, Major lakes:The World Factbook: Uganda - CIA
- Climate:Climate Change Knowledge Portal (ERA5 reanalysis) ↗ - World Bank
- Land use:FAOSTAT Land Use domain ↗ - FAO
- Natural hazards:INFORM Risk Index ↗ - European Commission Joint Research Centre
Demographics
- Population change2026
- +2.68% per year+1,376,576 people/yearWorld Rank18thof 237
- Birth rate
- 33.1 per 1,000 population
- Death rate
- 4.7 per 1,000 population
- Net migration rate
- −2.3 per 1,000 population
- 2026
- 17.1 yearsWorld Rank228thof 237
- Age structure2026
- 0-14 years42.7%15-64 years55.1%65 years +2.3%
- Share aged 65 and over
- 2.3%
- Share aged under 18
- 49.8%
- Total dependency ratio
- 82
- Youth dependency ratio
- 77
- Elderly dependency ratio
- 4
- Sex ratio
- 0.99 male / female
MaleAgeFemalePopulation by age group, % of total population Age Male Female 80+ 0.1% 0.2% 70-79 0.4% 0.6% 60-69 1.0% 1.3% 50-59 2.1% 2.2% 40-49 3.4% 3.6% 30-39 6.2% 6.4% 20-29 9.2% 9.2% 10-19 12.2% 12.1% 0-9 15.1% 14.8% - 2026
- 1.87 above the replacement level for Uganda ()3.97 births per womanreplacement 2.101234World Rank22ndof 237
- 1.85 daughters per woman0.85 above replacement, long-run each generation larger than the lastreplacement 1.000.511.52
- 2026
- +28.5 per 1,000 populationfor every 1,000 people, 28.5 more births than deaths a year
- 2026
- −2.3 per 1,000 population
- Urbanization2026
- 32.6% live in 17,195,887 urban residents
- Largest cities2024
- Kampala, Nansana, Kira, Makindye-SsabagaboRankCity or TownPopulation (2024 census)1Kampala1,797,7222Nansana692,4783Kira459,8274Makindye-Ssabagabo439,6055Arua384,6566Kyengera311,1127Mukono305,9458Masaka294,1669Mbale290,41410Jinja279,184Source:
- Uganda Bureau of Statistics (2024 census), via City Population by Thomas Brinkhoff ↗
- Population distribution
- Population density is relatively high in comparison to other African nations; most of the population is concentrated in the central and southern parts of the country, particularly along the shores of Lake Victoria and Lake Albert; the northeast is least populated.
- Ethnic groups2014
- Baganda16.5%Banyankole9.6%Basoga8.8%Bakiga7.1%Iteso7.0%Langi6.3%Bagisu4.9%Acholi4.4%Lugbara3.3%Other32.1%
- Religions2014
- Protestant45.1%Roman Catholic39.3%Muslim13.7%Other1.6%None0.2%
- Protestant
- 45.1%
- Anglican
- 32.0%
- Pentecostal/Born Again/Evangelical
- 11.1%
- Seventh Day Adventist
- 1.7%
- Baptist
- .3%
Source:- The World Factbook: Uganda - CIA
- Languages
- English, Swahili (Kiswahili)
- Population, Population change, Median age, Age structure, Total fertility rate, Net reproduction rate, Natural change, Net migration rate:UN World Population Prospects ↗
- Urbanization:UN World Urbanization Prospects ↗
- Largest cities:Uganda Bureau of Statistics (2024 census), via City Population by Thomas Brinkhoff ↗
- Population distribution, Ethnic groups, Religions:The World Factbook: Uganda - CIA
Government & Administration
- Form of state
- RepublicThe President, who is Head of State, Head of Government and Commander-in-Chief, is elected by universal adult suffrage through a secret ballot; the Constitution calls Uganda "one Sovereign State and a Republic" (Arts. 5, 98, 103).Source:
- Constitution of the Republic of Uganda, 1995, revised edition ↗, Arts. 5, 98, 103
- System of government
- PresidentialThe President appoints a Prime Minister, Leader of Government Business, with Parliament's simple-majority approval; ministers answer individually to the President, Parliament may only censure individual Ministers, and it dissolves only when its term expires (Arts. 96, 108A, 117, 118).Source:
- Constitution of the Republic of Uganda, 1995, revised edition ↗, Arts. 96, 108A, 117, 118
- Territorial organisation
- Unitary
- Official websites
- Capital
- Kampala1.8 million people(2024)
- National holidays
- 16 days in 2026
- ThuJan 1New Year's Day
- ThuJan 15General Elections
- FriJan 16General Elections
- MonJan 26NRM Liberation Day
- MonFeb 16Archbishop Janani Luwum Day
- SunMar 8Women's Day
- FriMar 20Eid al-Fitr (estimated)
- FriApr 3Good Friday
- MonApr 6Easter Monday
- FriMay 1Labour Day
- WedMay 27Eid al-Adha (estimated)
- WedJun 3Uganda Martyrs' Day
- TueJun 9National Heroes' Day
- FriOct 9Independence Day
- FriDec 25Christmas Day
- SatDec 26Boxing Day
Nationwide public holidays only, excluding regional, bank and government-only days.
- Time
- EATEast Africa TimeUTC+3
- Currency
- Ugandan Shilling (UGX)
- Entry requirements
- Official visa and entry information
- Calling code
- +256
- Internet TLD
- .ug
- ISO 3166-1 codes
- UG, UGA
- Infrastructure
- Railways1,244 km
- Passengers carried
- 21,650 by the country's airlines(2023)
- Aircraft departures
- 1,425 by the country's airlines(2023)
- Air freight
- 0.1 million tonne-km(2023)
- Aircraft registration prefix
- 5X
Sources:- The World Factbook: Uganda - CIA
- World Development Indicators ↗ - World Bank
- Flag carrier
- Uganda AirlinesState-owned
- Passenger rail
- Uganda Railways Corporation
- 2025
- 25 / 100World Rank148thof 182Confidence interval
Corruption index score by year Year Score Lower bound Upper bound 2012 29 25 32 2013 26 21 31 2014 26 21 31 2015 25 20 30 2016 25 22 29 2017 26 23 29 2018 26 23 29 2019 28 24.7 31.3 2020 27 25.1 28.9 2021 27 25 29 2022 26 23.6 28.4 2023 26 23.9 28.1 2024 26 24 28 2025 25 23 27 Source:- Corruption Perceptions Index 2025 ↗ - Transparency International, CC BY 4.0
- Form of state, System of government, Territorial organisation:Constitution of the Republic of Uganda, 1995, revised edition ↗ - Ministry of Lands, Housing and Urban Development of Uganda
- National holidays:Open World Holidays Framework (vacanza/holidays) ↗
- Infrastructure:The World Factbook: Uganda - CIA
- Infrastructure:World Development Indicators ↗ - World Bank
- Corruption Perceptions Index:Corruption Perceptions Index 2025 ↗ - Transparency International, CC BY 4.0
Economy
- Low income
- GDP growth (real)2026
- +6.2% per yearWorld Rank19thof 195
- GDP per capita (PPP)2026
- GDP per capita (nominal)
- $1,453 (172nd in the world)
Source:- 2025
- Services42.1% of GDPIndustry24.3% of GDPAgriculture26.1% of GDPManufacturing14.5%part of industry
- Households
- +65.2%
- Government
- +11.7%
- Investment
- +22.6%
- Exports
- +21.4%
- Imports
- −28.8%
The shape of the economyGDP by end useThe five add up to 92.2% of GDP, not 100. The gap is in the source data.
Source:- World Development Indicators ↗ - World Bank
- Inflation2026
- 4.2%up 0.6 percentage points0.6pp from 2025
- Labor force2024
- 22.6 million (45% of population)World Rank31stof 187
- Labor force participation2024
- 80.0% of people aged 15+
- Unemployment2024
- 2.7%
- Youth unemployment2024
- 4.2% ages 15 to 24
- Labor productivity2024
- $3 per hour worked at PPP
- Budget balance2026
- 5.8% of GDP deficit
- Current account
- 7.3% of GDP, $5.3 billion deficit
Source: - Debt2024
- Central government debt51.8% of GDPInterest on debt3.3% of GDP
- Trade2024
- Goods$8.7 billion77.2%
- Services$2.6 billion22.8%
- Total exports
- $11.2 billion
- Change from 2023
- up 25.3 percent on the previous year25.3%
Sources:- World Development Indicators ↗ - World Bank
- The World Factbook: Uganda - CIA
- 2024
- −0.52World Rank97thof 145
- Projected GDP growth
- +5.7% a year over the next 10 years
Source:- Atlas of Economic Complexity ↗ - Harvard Growth Lab
- Agricultural products2024
- Plantains and cooking bananas, Coffee (green), Beans (dry), and 7 more
- 1Plantains and cooking bananas84.9×
- 2Coffee (green)11.4×
- 3Beans (dry)8.4×
- 4Tea leaves4.1×
- 5Sweet potatoes3.6×
- 6Raw milk of cattle1.5×
- 7Cassava (fresh)1.5×
- 8Maize (corn)1.3×
- 9Sugar cane1×
- 10Potatoes0.4×
ProductSource:- FAOSTAT ↗ - Food and Agriculture Organization
- Industries
- sugar processing, brewing, tobacco, cotton textiles
- cement, steel production
- Income level, GDP by sector, Trade:World Development Indicators ↗ - World Bank
- GDP (nominal), GDP growth (real), GDP per capita (PPP), Inflation, Budget balance:IMF World Economic Outlook ↗
- Labor force, Labor force participation, Unemployment, Youth unemployment, Labor productivity:ILOSTAT ↗ - International Labour Organization
- Debt:IMF Global Debt Database ↗
- Debt:IMF Public Finances in Modern History ↗
- Trade, Industries:The World Factbook: Uganda - CIA
- Economic Complexity Index:Atlas of Economic Complexity ↗ - Harvard Growth Lab
- Agricultural products:FAOSTAT ↗ - Food and Agriculture Organization
Cost of Living
- Cost of living index
- Loading
- Monthly costs (excluding rent)
- Loading
- Rent
- Loading
- Buying an apartment
- Loading
- Average gross salary2021
- UGX 577,678 per month$161 (USD), $439 (PPP)
- Median
- UGX 240,000 per month($67)
- Men
- UGX 671,749 per month($187)
- Women
- UGX 371,043 per month($103)
Source:- ILOSTAT ↗ - International Labour Organization
- 2024
- UGX 130,000 per month, gross$35 (USD), $98 (PPP)
- Average gross salary, Minimum wage:ILOSTAT ↗ - International Labour Organization
Society
- 2023
- 0.582MediumWorld Rank157thof 193UgandaWorld
Human Development Index by year Year Uganda World 1990 0.342 0.608 1991 0.345 0.611 1992 0.339 0.614 1993 0.347 0.617 1994 0.350 0.620 1995 0.356 0.625 1996 0.367 0.631 1997 0.376 0.636 1998 0.386 0.641 1999 0.398 0.646 2000 0.407 0.651 2001 0.418 0.657 2002 0.432 0.662 2003 0.446 0.669 2004 0.461 0.675 2005 0.470 0.681 2006 0.481 0.688 2007 0.492 0.694 2008 0.502 0.698 2009 0.509 0.701 2010 0.514 0.707 2011 0.522 0.713 2012 0.526 0.717 2013 0.532 0.721 2014 0.539 0.726 2015 0.547 0.731 2016 0.553 0.735 2017 0.557 0.739 2018 0.563 0.741 2019 0.569 0.745 2020 0.571 0.742 2021 0.573 0.742 2022 0.578 0.752 2023 0.582 0.756 Source:- Human Development Report ↗ - United Nations Development Programme
- 2019
- 42.7
- Mean years of schooling2023
- 6.3 years
- Expected for a child today
- 11.6 years
Source:- Human Development Report ↗ - United Nations Development Programme
- Literacy2024
- 77% of adults
- Education expenditure2022
- 2.6% of GDP
- Share of government spending
- 8.5%
Source:- World Development Indicators ↗ - World Bank
- Internet users2024
- 8.9% of the population
- Households with Internet access
- 38.3%
Source:- ITU DataHub ↗ - International Telecommunication Union
- Mobile subscriptions2024
- 41.6 million
- Fixed telephone lines
- 195,975
- Fixed broadband
- 0.2 subscriptions per 100 people
Counts subscriptions, not people.
Source:- ITU DataHub ↗ - International Telecommunication Union
- Credit-card ownership2024
- 2% of adults
- Debit-card ownership
- 9%
- Account at a bank or mobile-money provider
- 73%
- Mobile-money account
- 68%
- Made or received a digital payment
- 71%
Source:- Global Findex Database ↗ - World Bank
- Refugees hosted2025
- 1.9 million people
- Asylum seekers
- 39,990
- Stateless persons
- 10,284
- Internally displaced persons
- 22,0002,000 due to conflicts, 20,000 due to disasters
- Refugees from Uganda abroad
- 11,590
Sources:- Refugee Data Finder ↗ - UN Refugee Agency
- Global Internal Displacement Database ↗ - Internal Displacement Monitoring Centre
- Inbound tourists2021latest available
- 513,000 arrivalsdown 67% against 201967% below 2019Official tourism site
- Per resident
- 1.1 arrivals per 100 residents
- $1.3 billion(2023)
- Share of GDP
- 3.2% tourism direct GDP(2023)
- Domestic trips
- 1.2 million overnight trips by residents(2019, latest available)
- Residents' trips abroad
- 331,000 overnight trips
- $508.6 million(2023)
- Hotel beds
- 85,463(2016, latest available)
Overnight arrivals by year2010 to 2021A tourist stays at least one night. Arrivals count trips, not people.
Source:- UN Tourism Data Dashboard ↗ - UN Tourism
- UNESCO World Heritage Sites
- 3 sites1 cultural2 natural
Site Type Bwindi Impenetrable National Park Natural Rwenzori Mountains National Park Natural Tombs of Buganda Kings at Kasubi Cultural Source:- The World Factbook: Uganda - CIA
- Human Development Index, Mean years of schooling:Human Development Report ↗ - United Nations Development Programme
- Income inequality (Gini), Education expenditure:World Development Indicators ↗ - World Bank
- Literacy:UIS Data Browser ↗ - UNESCO Institute for Statistics
- Internet users, Mobile subscriptions:ITU DataHub ↗ - International Telecommunication Union
- Credit-card ownership:Global Findex Database ↗ - World Bank
- Refugees hosted:Refugee Data Finder ↗ - UN Refugee Agency
- Refugees hosted:Global Internal Displacement Database ↗ - Internal Displacement Monitoring Centre
- Inbound tourists:UN Tourism Data Dashboard ↗ - UN Tourism
- UNESCO World Heritage Sites:The World Factbook: Uganda - CIA
Crime & Safety
- Travel advisory (US)
- Loading
- Active humanitarian crisisAug 2026
- High6.4 out of 10Drought and drier conditions, International displacement
Crisis Since Sep 2024 Severity Country overallAll crises below combined 6.4High International Displacement to UgandaInternational displacement 6.1High Food Security Crisis in Karamoja RegionDrought and drier conditions 5.1Medium Data reliability as rated by INFORM: High. Last updated Aug 25, 2026.
Source:- INFORM Severity Index ↗ - European Commission Joint Research Centre
- Homicide rate2024
- Medium by global standards8.8 per 100,000 peopleWorld Rank22ndof 115
- Crime rates
- 7 offence categories
Offence Per 100,000 Count Year Homicide (victims) 8.8 4,411 2024 Serious assault 14.3 5,732 2017 Sexual violence 50.4 19,548 2016 Kidnapping 2.4 938 2016 Burglary 19.8 7,697 2016 Theft 112.2 43,515 2016 Vehicle theft 3.8 1,461 2016 A low figure can also mean weak recording.
Source:- UNODC Data Portal ↗ - UN Office on Drugs and Crime
- Prison population2022
- 149.1 per 100,000 people
- Persons held
- 70,535
Source:- UNODC Data Portal ↗ - UN Office on Drugs and Crime
- Active humanitarian crisis:INFORM Severity Index ↗ - European Commission Joint Research Centre
- Homicide rate, Crime rates, Prison population:UNODC Data Portal ↗ - UN Office on Drugs and Crime
Health
- Life expectancy2026
- 68.9 years
- Health expenditure2023
- 4.2% of GDP$45 per person
- Physicians2022
- 0.19 per 1,000 population
- Hospital beds2010latest available
- 0.5 per 1,000 population
- Infant mortality2026
- 26.1 per 1,000 live births
- Maternal mortality2023
- 170 per 100,000 live births
- Alcohol consumption2022
- 6.3 litres of pure alcohol per adult per year
- Tobacco use2023
- 7.9% of adults
- Men
- 12.6%
- Women
- 3.1%
Source:- Global Health Observatory ↗ - World Health Organization
- Alcohol and Tobacco Spending2023
- 1.5% of household spendingWorld Rank83rdof 105
- World median
- 3.1%
Source:- The World Factbook: Uganda - CIA
- Road traffic deaths2019
- 29.4 per 100,000 population
- Life expectancy, Infant mortality:UN World Population Prospects ↗
- Health expenditure, Physicians, Hospital beds, Road traffic deaths:World Development Indicators ↗ - World Bank
- Maternal mortality:Maternal mortality estimates ↗ - UN Maternal Mortality Estimation Inter-agency Group
- Alcohol consumption, Tobacco use:Global Health Observatory ↗ - World Health Organization
- Alcohol and Tobacco Spending:The World Factbook: Uganda - CIA
Environment
- CO₂ emissions2024
- 8.25 Mt per yearup 1.7 percent on the previous year1.7% from 2023
- CO₂ per capita
- 0.2 t per personWorld Rank198thof 207
- Share of global CO₂
- 0.02%
- Methane (CH₄)
- 38.2 Mt CO₂-eq
- Nitrous oxide (N₂O)
- 10.8 Mt CO₂-eq
- All greenhouse gases
- 57.3 Mt CO₂-eq
Source:- Emissions Database for Global Atmospheric Research (EDGAR) ↗ - European Commission, Joint Research Centre
- 2024
- 36.3 µg/m³ of PM2.53.1 years of life expectancy lost against the WHO guidelineMost polluted13thof 236
- WHO guideline
- 5 µg/m³
- National standard
- 25 µg/m³
- Life expectancy gain if the national standard were met
- 1.1 years
Source:- Air Quality Life Index ↗ - Energy Policy Institute at the University of Chicago
- Environmental issues
- draining of wetlands for agricultural use
- deforestation
- overgrazing
- soil erosion
- water pollution from industrial discharge and water hyacinth infestation in Lake Victoria
- widespread poaching
Source:- The World Factbook: Uganda - CIA
- International agreements
- 19 of 20 landmark treaties in forceParty to 55 multilateral environmental agreements
Treaty Standing Joined Climate Paris Agreement in force 2016 UN Framework Convention on Climate Change in force 1994 Kyoto Protocol in force 2005 Ozone layer Montreal Protocol in force 1989 Vienna Convention (Ozone Layer) in force 1988 Biodiversity Convention on Biological Diversity in force 1993 CITES in force 1991 Convention on Migratory Species (Bonn) in force 2000 Cartagena Protocol on Biosafety in force 2003 Nagoya Protocol in force 2014 Land and heritage Ramsar Convention on Wetlands in force 1988 World Heritage Convention in force 1988 UN Convention to Combat Desertification in force 1997 Chemicals and waste Basel Convention in force 1999 Rotterdam Convention (PIC) in force 2008 Stockholm Convention (POPs) in force 2004 Minamata Convention on Mercury in force 2019 Oceans UN Convention on the Law of the Sea in force 1994 High Seas Treaty (BBNJ) not a party MARPOL 73/78 in force 2019 Source:- International Environmental Agreements Database ↗ - Université Laval
- CO₂ emissions:Emissions Database for Global Atmospheric Research (EDGAR) ↗ - European Commission, Joint Research Centre
- Air pollution:Air Quality Life Index ↗ - Energy Policy Institute at the University of Chicago
- Environmental issues:The World Factbook: Uganda - CIA
- International agreements:International Environmental Agreements Database ↗ - Université Laval
Food & Water
- No access to safe drinking water2022
- 21% of the population
- Renewable water2022
- 60 billion m³ per year
- Per person
- 1,270 m³ per year
- Dependency ratio
- 35% originates outside the country
- Annual water withdrawal
- 0.6 billion m³ per year
- Withdrawn for agriculture
- 41%
- Water stress
- 6% of available freshwater withdrawn
Source:- AQUASTAT ↗ - Food and Agriculture Organization
- Undernourishment2022
- 36.8% of the population16.9 million people
- Obesity2024
- 9.5% of adults
- Men
- 4.5%
- Women
- 14.1%
Source:- Global Health Observatory ↗ - World Health Organization
- Underweight children2022
- 9.7% of children under five
- No access to safe drinking water, Renewable water:AQUASTAT ↗ - Food and Agriculture Organization
- Undernourishment:Food security indicators (FAOSTAT) ↗ - Food and Agriculture Organization
- Obesity:Global Health Observatory ↗ - World Health Organization
- Underweight children:World Development Indicators ↗ - World Bank
Energy
- Energy consumption2024
- Per capita
- 2.29 GJ per person
- Share of world total
- 0.02%
- Supply
- Deficitproduces 20% of what it consumes, 2024
Source:- International Energy Statistics ↗ - U.S. Energy Information Administration
- Electricity2024
- Net exporter, net 0.4 TWh in 2024, 11% of consumption5.8 TWh generated per year
- Generation
- 5.8 TWh per year
- Consumption
- 4.2 TWh per year
- Imports
- 0 TWh per year
- Exports
- 0.5 TWh per year
- Net
- +0.4 TWh per year
Source:- International Energy Statistics ↗ - U.S. Energy Information Administration
- Oil, gas & coal
- No domestic productionconsumes 44,015 b/d in 2024Oil reserves20252.5 billion barrelsWorld Rank32ndof 99Consumption202444,015 b/d
Oil imports and exports count crude oil only.
- Energy consumption, Electricity, Oil, gas & coal:International Energy Statistics ↗ - U.S. Energy Information Administration
- Oil, gas & coal:Worldwide Oil and Gas Survey ↗ - Oil & Gas Journal
Defense
- Military expenditure2024
- 1.9% of GDP$1.1 billion, 10.1% of government spending
- Military personnel2025
- approximately 45,000active Defense Forces
- Military service2025
- Voluntarymen and women 18–22; 9-year service obligation
- Nuclear weapons2026
- None - no nuclear arsenal
- Military expenditure:SIPRI Military Expenditure Database ↗ - Stockholm International Peace Research Institute
- Military expenditure:World Development Indicators ↗ - World Bank
- Military personnel, Military service:The World Factbook: Uganda - CIA
- Nuclear weapons:Status of World Nuclear Forces ↗ - Federation of American Scientists

